
GME Graphs and Short Interest Price Evaluation
Short Interest Graphs and Price Evaluation for GME Stock in March April 2021
Because apes keep asking and saying that 1k, 100k, 500k, 2m, 10m, 20m is impossible, I’ve decided to help people out with learning how to use Geometric Mean. This lets us estimate the price per share as people jump off at different points on the way up, which is expected, everyone has a different price point, just as different sell points are expressed.
Geometric mean is basically an average of numbers that have exponential growth. For Apespeak, Bananas that grows more bananas as you eat them. You take the Max share price you expect, and then the current shareprice, and you calculate the Geometric Mean. This article explains it better than I can, I just am a retarded ape that loves crayons with colors out of space.
For argument’s sake, we are going to use 150% short, so 75 million shares that need to be covered.
The numbers below are the peak
Price Per Share of GME Stock and Overall Price
Price per Share, Total Payout of GME, and overall price per share for the payout.
So without Further ado
1k per share price total payout would be $33,525,000,000 @ 447 per share (Geometric Mean)
5k per share price total payout would be $75,000,000,000 @ 1000 per share (Geometric Mean)
10k per share price total payout would be $106,050,000,000 @ 1414 per share (Geometric Mean)
42k per share price total payout would be $217,350,000,000 @ 2898 per share (Geometric Mean)
GME SHORT INTEREST AND PAY OUT PER SHARE CONTINUED
69k per share price total payout would be $278,550,000,000 @ 3714 per share (Geometric Mean)
100k per share price total payout would be $335,400,000,000 @ 4472 per share (Geometric Mean)
500k per share price total payout would be $750,000,000,000 @ 10000 per share (Geometric Mean)
1m per share price total payout would be $1,060,650,000,000 @ 14142 per share (Geometric Mean)
2m per share price total payout would be $1,500,000,000,000 @ 20000 per share (Geometric Mean)
20m per share price total payout would be $4,743,375,000,000 @ 63245 per share (Geometric Mean)
TLDR: In summation, it’s really not as much as a payout as you think, regardless of its Peak. So you might say “Hey wait! X price is too damn much! We’d bleed the world dry and awaken Elder gods!” And I say, “Nay fair Ape, you’d only cause Azathoth to roll over. There will still be a world left to enjoy your tendies. Even at 20 mill per share.”
Pease note that this option chain will change as the week goes on. This is only a preliminary scan.
In order for the Option Chain to favor the HFs, they will want GME to get below 175 where more puts will be ITM than calls.
The spread at 200 is more than double the spread at 195. If Hedge Funds can’t get below 170, getting it below 200 is imperative for them as the spread begins to get out of hand.
Total Calls and Puts ITM stays steady from 170 to 200, however that number begins to increase dramatically beyond 200. That difference is made up by a dramatic increase in Calls falling ITM. This means that a Gamma Squeeze may occur at around 250 and begin to compound if it reaches 300, 350, etc.
Total GME Stock Still Puzzles Analysts

Second, according to Investopedia, there are a few conditions for a real cup with handle chart pattern on GME:
- Trend: To qualify as a continuation pattern, a prior trend should exist. Ideally, the trend should be a few months old and not too mature. Check
- Cup: The cup should be “U” shaped and resemble a bowl or rounding bottom. A “V” shaped bottom would be considered too sharp of a reversal to qualify. Check
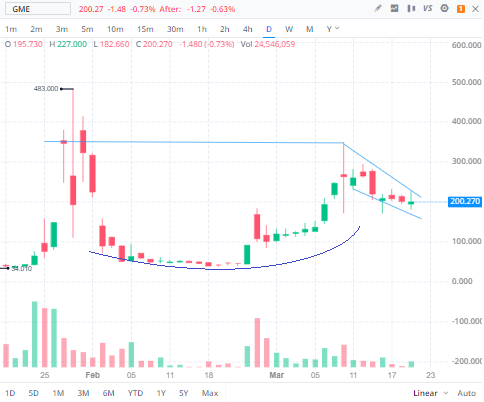
- Cup Depth: Ideally, the depth of the cup should retrace 1/3 or less of the previous advance. However, with volatile markets and over-reactions, the retracement could range from 1/3 to ½. Kinda check? We fell from 483 to around 38 so this was a very abnormal retracement, and so we need to be a little weary.
- Handle: After the high forms on the right side of the cup, there is a pullback that forms the handle. Sometimes this handle resembles a flag or pennant that slopes downward, other times it is just a short pullback. The handle represents the final consolidation/pullback before the big breakout and can retrace up to 1/3 of the cup’s advance, but usually not more. The smaller the retracement, the more bullish the formation and significant the breakout. Kinda check again?We fell from around 340 to 173, at one point. However, if only opening and closing prices ranges are factored, it would be 275 to 201. This is only a 27% drop and a 33% drop would be 183.15.
- Duration: The cup can extend from 1 to 6 months, sometimes longer on weekly charts. The handle can be from 1 week to many weeks and ideally completes within 1-4 weeks. Almost there
- Volume: There should be a substantial increase in volume on the breakout above the handle’s resistance. Maybe one day?
Okay now let’s look at just the handle:

Knowing that our bear trends for GME usually last 6-14 days
So we can clearly see downward trend lines with a support line hovering around 180ish here. It is also backed with decreased MACD momentum, slight overselling (W%R trending down), and signs of a DMI convergence (evidence of bearish sentiment). We will need to see if a downward triangle forms in the coming weeks. If one forms, then that further confirms bearish sentiment.
Looking back at our handle rules, we can see that a handle must be formed in 1-4 weeks, and it looks like the handle formation began 6 trading days ago.
Knowing that our bear trends for GME usually last 6-14 days, the timing lines up perfectly for proper handle formation.
The only thing left is to wait out the handle and get a solid breakout with huge volume. Then GME go boom boom.
Evidence of cup with handle pattern: two high resistances with a low “U” shaped support in the middle. Formation of 1-4 weeks of price stagnation with a downward trendlines. Handle supported by W%R, DMI, and MACD.
Potential Reason GME Stock may fall out of pattern
Potential reasons cup with handle might fail: Price fell too low out of expected range during “U” formation. Potentially, price might fall too low during handle formation, and most importantly there needs to be large volume to breakout of the handle. Also, there may be a sub pattern forming as an inverse cup from 3/16-3/19. I have not analyzed it much yet, but it was pointed out to me by another redditor.
Edit: Added one more potential reasons cup with handle might fail.
Edit2: Removed links.
Edit3: My bad yall! As pointed out in comments, not descending triangle as that is a continuation pattern not a reversal pattern. Changing it to say “downward trendlines” instead, cant change the title unfortunately LOL what can i say im retarded